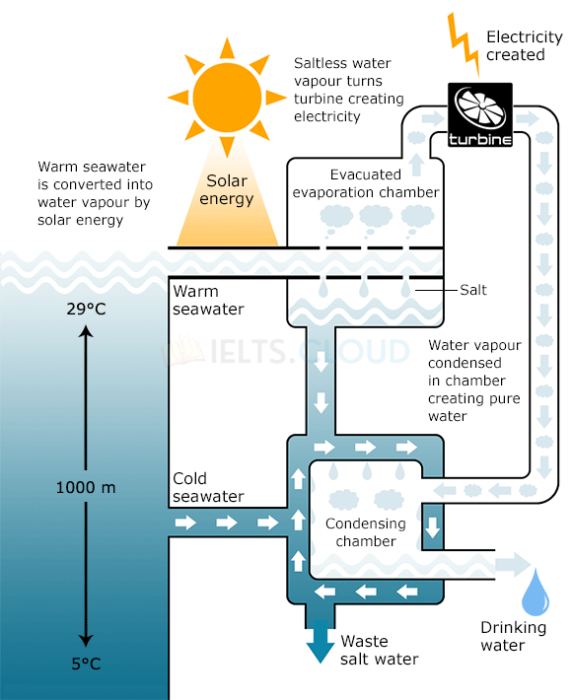
The diagram below shows the production of electricity using a system called Ocean Thermal Energy Conversion (OTEC).
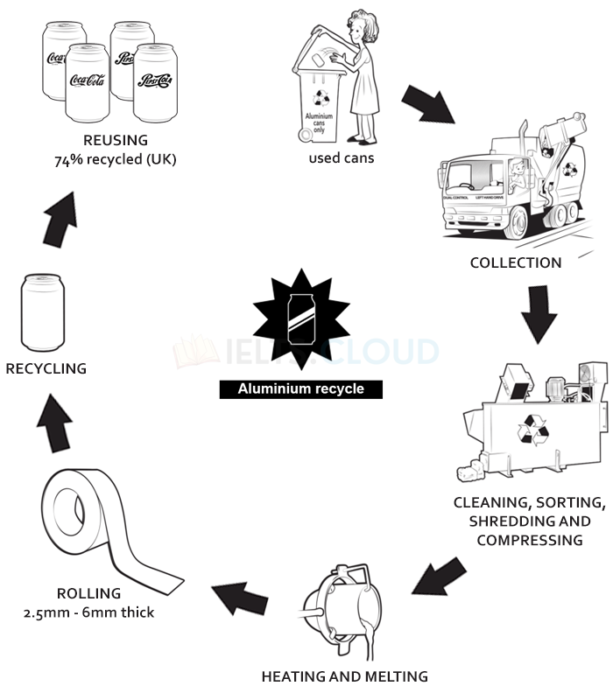
Diagram#3 | Recycling Process of Aluminium Cans
The diagram below shows the recycling process of aluminium cans.
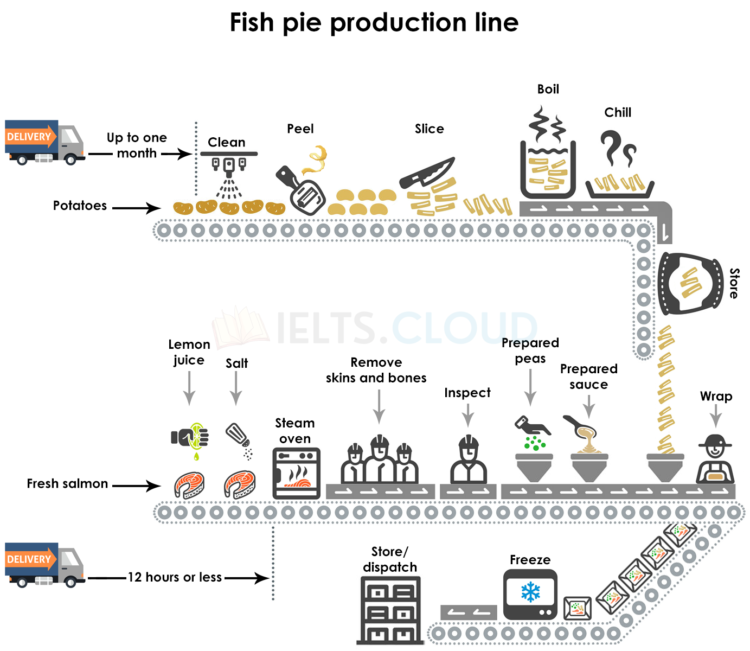
Diagram#2 | Fish Pie Production Line
The diagrams below give information about the manufacture of frozen fish pies.
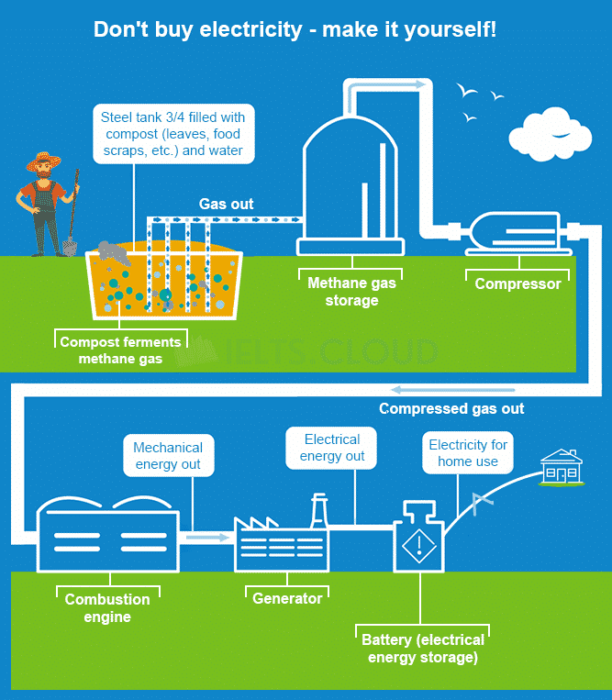
Diagram#1 | Energy Production
The diagram below shows a possible future means of home energy production.
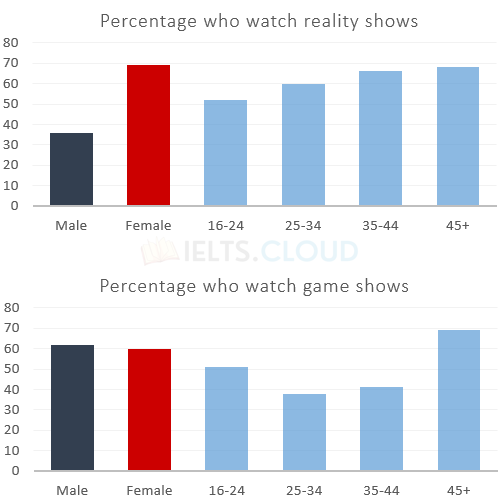
Bar-Graph#15 | Percentage who watch reality shows
The charts give information about two genres of TV programmes watched by men and women and four different age groups in Australia.
Bar-Graph#14 | Airport visitors in New York City
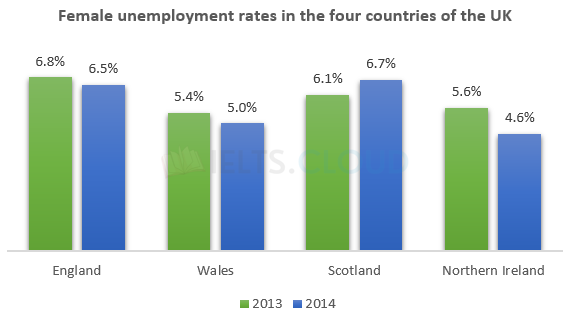
The graph below shows female unemployment rates in each country of the United Kingdom in 2013 and 2014.
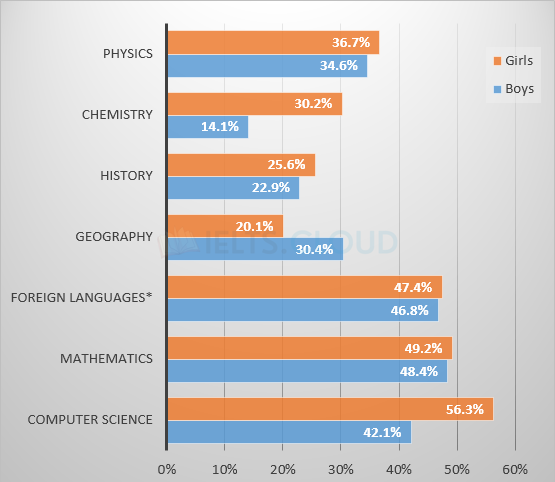
Bar-Graph#13 | Students passing high school competency exams
The bar chart below shows the percentage of students who passed their high school competency exams, by subject and gender, during the period 2010-2011.
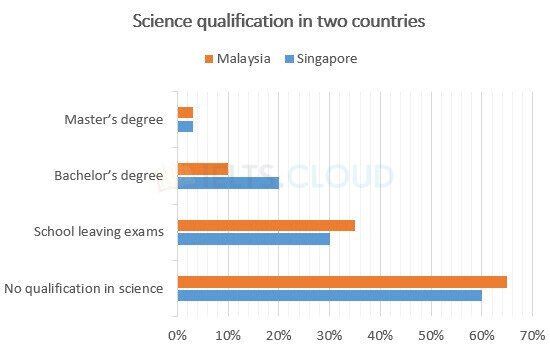
Bar-Graph#12 | Information About Science Qualifications
The chart below gives information about science qualifications held by people in two countries.
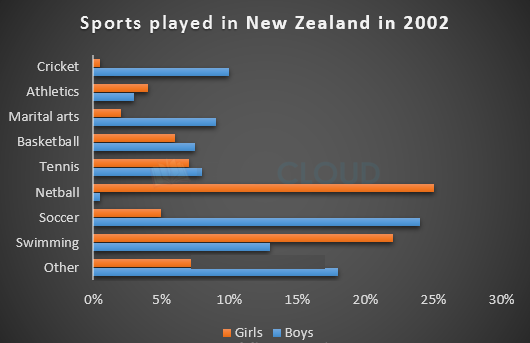
Bar-Graph#11 | Sports played in New Zealand
The chart below gives information about the most common sports played in New Zealand in 2002.
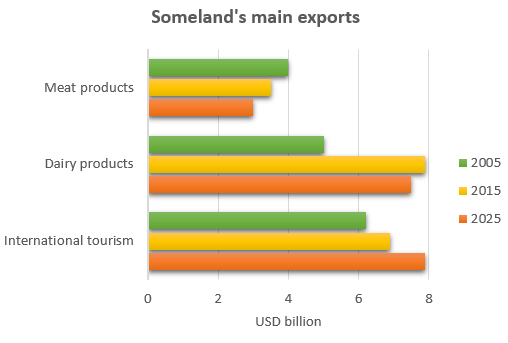
Bar-Graph#10 | Someland’s Main Exports
The chart below gives information about Someland’s main exports in 2005, 2015, and future projections for 2025.