Categories
  • General – Letter Writing
  • Academic Writing Task 1
  • Bar Graphs
  • IELTS Diagram
  • IELTS Line Graphs
  • IELTS Maps
  • Pie Charts
  • Tables
  • IELTS Writing Task 2
  • Advantages and Disadvantages Essay
  • Discussion Essay
  • Double Question Essay
  • Opinion Essay
  • Problem Solution Essay
  • IELTS General Reading
  • IELTS Academic Reading
  • IELTS Listening
  • IELTS Reading Samples
  • IELTS Speaking
  • Listening Samples
  • IELTS Tips
iELTS.CLOUD-sticky logo
  • Home
  • Listening
  • Reading
    • General Reading
    • Academic Reading
  • IELTS Writing
    • IELTS Writing Task 2
    • IELTS Writing Task 1
  • Speaking
  • IELTS FAQs
  • Home
  • Listening
  • Reading
    • General Reading
    • Academic Reading
  • IELTS Writing
    • IELTS Writing Task 2
    • IELTS Writing Task 1
  • Speaking
  • IELTS FAQs
iELTS.CLOUD-Mobile LogoiELTS.CLOUD-Light LOGO
  • Home
  • Listening
  • Reading
    • General Reading
    • Academic Reading
  • IELTS Writing
    • IELTS Writing Task 2
    • IELTS Writing Task 1
  • Speaking
  • IELTS FAQs
  • Home
  • Listening
  • Reading
    • General Reading
    • Academic Reading
  • IELTS Writing
    • IELTS Writing Task 2
    • IELTS Writing Task 1
  • Speaking
  • IELTS FAQs

Posts Tagged "Bar Graphs"

Home » Bar Graphs
  • General – Letter Writing
  • Academic Writing Task 1
  • Bar Graphs
  • IELTS Diagram
  • IELTS Line Graphs
  • IELTS Maps
  • Pie Charts
  • Tables
  • IELTS Writing Task 2
  • Advantages and Disadvantages Essay
  • Discussion Essay
  • Double Question Essay
  • Opinion Essay
  • Problem Solution Essay
  • IELTS General Reading
  • IELTS Academic Reading
  • IELTS Listening
  • IELTS Reading Samples
  • IELTS Speaking
  • Listening Samples
  • IELTS Tips
Percentage who watch reality shows and game shows
by AdminWriting, Bar Graphs, IELTS Academic Writing Task 1, Bar Graphs01/01/2021

Bar-Graph#15 | Percentage who watch reality shows

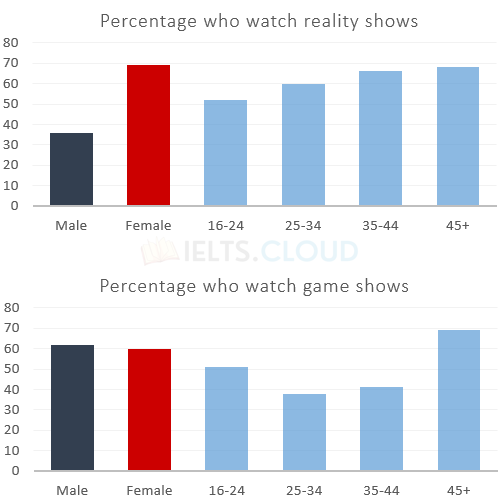
The charts give information about two genres of TV programmes watched by men and women and four different age groups in Australia.

64
Read More
Airport visitors in New York City
by AdminWriting, Bar Graphs, IELTS Academic Writing Task 1, Bar Graphs01/01/2021

Bar-Graph#14 | Airport visitors in New York City

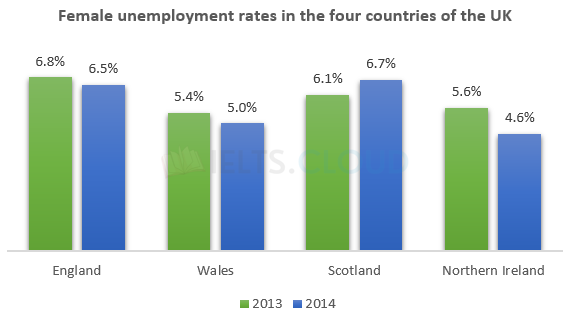
The graph below shows female unemployment rates in each country of the United Kingdom in 2013 and 2014.

47
Read More
IELTS_Writing_Task_1_BarChart-13
by AdminWriting, Bar Graphs, IELTS Academic Writing Task 1, Bar Graphs01/01/2021

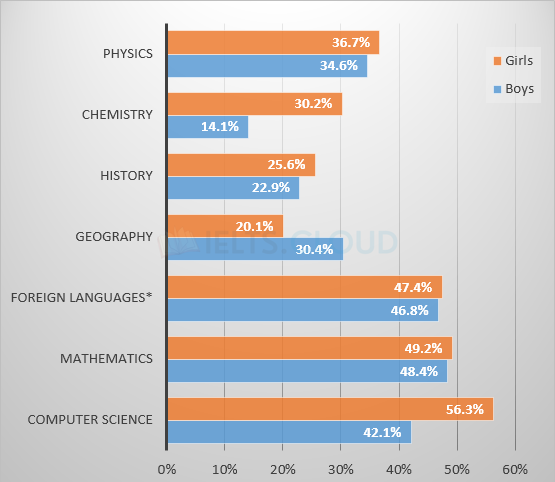
Bar-Graph#13 | Students passing high school competency exams

The bar chart below shows the percentage of students who passed their high school competency exams, by subject and gender, during the period 2010-2011.

40
Read More
IELTS_Writing_Task_1_BarChart-12
by AdminWriting, Bar Graphs, IELTS Academic Writing Task 1, Bar Graphs01/01/2021

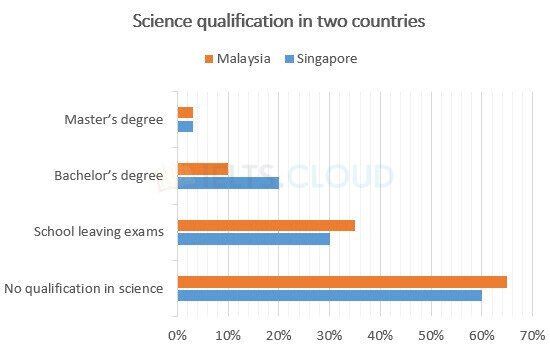
Bar-Graph#12 | Information About Science Qualifications

The chart below gives information about science qualifications held by people in two countries.

35
Read More
IELTS_Writing_Task_1_BarChart-11
by AdminWriting, Bar Graphs, IELTS Academic Writing Task 1, Bar Graphs01/01/2021

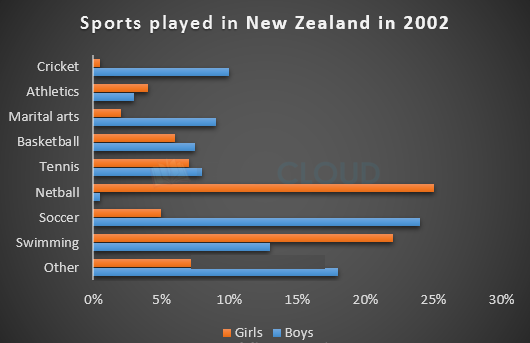
Bar-Graph#11 | Sports played in New Zealand

The chart below gives information about the most common sports played in New Zealand in 2002.

47
Read More
IELTS_Writing_Task_1_BarChart-10
by AdminWriting, Bar Graphs, IELTS Academic Writing Task 1, Bar Graphs01/01/2021

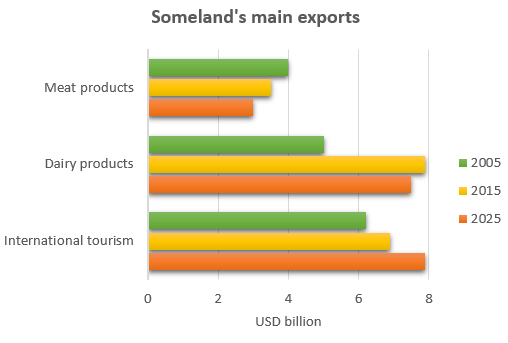
Bar-Graph#10 | Someland’s Main Exports

The chart below gives information about Someland’s main exports in 2005, 2015, and future projections for 2025.

32
Read More
IELTS_Writing_Task_1_BarChart-9
by AdminWriting, Bar Graphs, IELTS Academic Writing Task 1, Bar Graphs01/01/2021

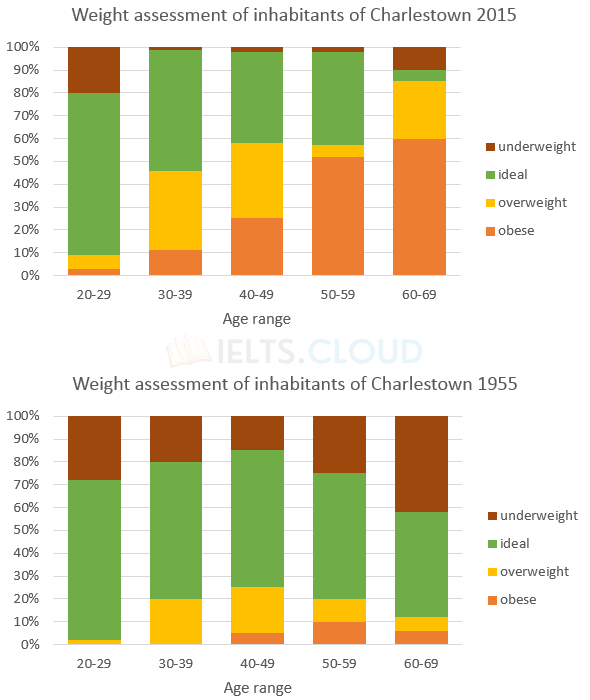
Bar-Graph#9 | Weight Measurements

The charts summarise the weight measurements of people living in Charlestown in 1955 and 2015.

31
Read More
IELTS_Writing_Task_1_BarChart-8
by Admin1 СommentWriting, Bar Graphs, IELTS Academic Writing Task 1, Bar Graphs01/01/2021

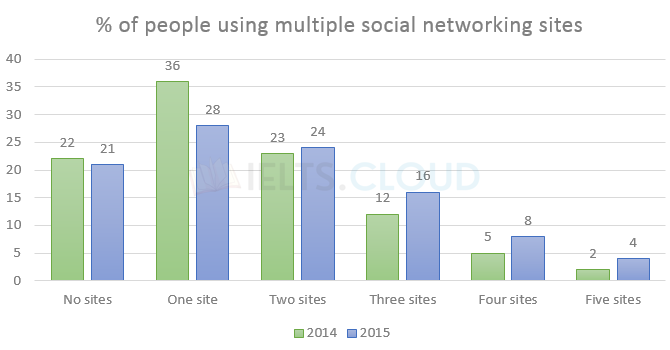
Bar-Graph#8 | Social Networking Sites

The chart below gives information about the number of social networking sites people used in Canada in 2014 and 2015.

38
Read More
IELTS_Writing_Task_1_BarChart-7
by AdminWriting, Bar Graphs, IELTS Academic Writing Task 1, Bar Graphs01/01/2021

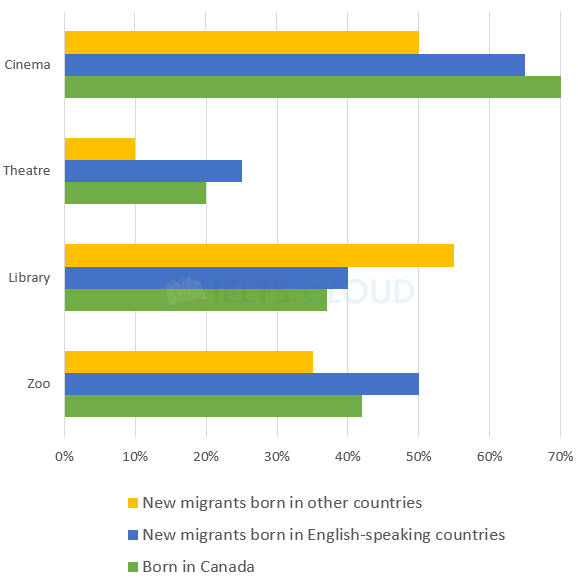
Bar-Graph#7 | People Living in Canada

The chart below shows the places visited by different people living in Canada.

31
Read More
IELTS_Writing_Task_1_BarChart-5
by AdminWriting, Bar Graphs, IELTS Academic Writing Task 1, Bar Graphs01/01/2021

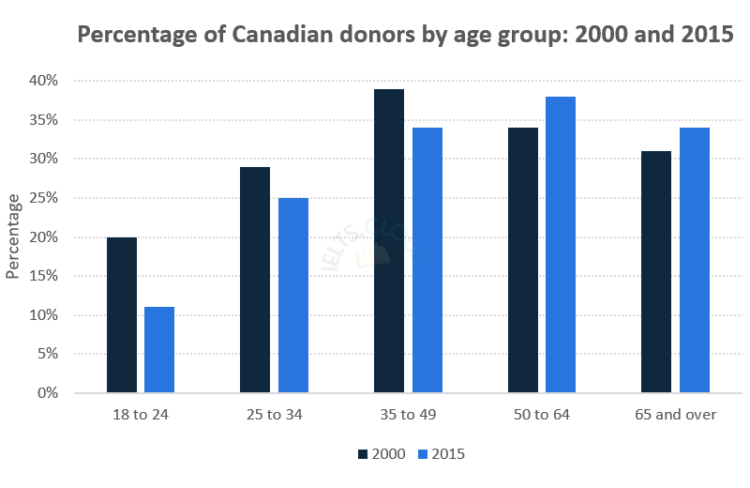
Bar-Graph#6 | Canadians

The chart below gives information on the percentage of Canadians gave money to charitable organisations by age range for the years 2000 and 2015.

31
Read More
1 2
Popular Tutorials
  • Bar Graphs
  • IELTS Interviews
  • IELTS Writing Task 2
  • IELTS Line Graphs
  • Pie Charts
Terms of Use

The reading, writing and listening practice tests in IELTS.CLOUD have been designed to resemble the format of the IELTS test as closely as possible. They are not, however, real IELTS tests; they are designed to practise exam technique to help students to face the IELTS test with confidence and to perform to the best of their ability. While using this site, you agree to have read and accepted our terms of use, cookie and privacy policy.

© 2020 IELTS.CLOUD | All rights reserved
  • Privacy Policy